“I keep facing the same decks!” All Hearthstone players know that feeling; even though the number of ways to construct a 30-card deck is essentially infinite, there is a set of relatively few deck archetypes at any one time in the meta that are used more than others – Embiggen Druid, Mech Paladin, Dragon Hunter, and so on.
The next logical question is, “Which deck(s) should I play in response?”1 You could just use the top archetype in terms of winning percentages (call it X), and that's certainly a valid starting point. Or maybe you think this is obvious, so you'll think one step ahead and play the archetype that has the highest win percentage against X (call it Y). But then, you might think, others might use the same idea (especially after reading this article), so now you'll want to find archetypes that are good against both X and Y, and so on and so on: turtles all the way down.
This is the point where you realize (if you're the type of person who has these realizations, which thank goodness isn't everybody) that it's time for a little game theory to answer the basic question: what mix of archetypes should I select to play even if everyone else uses the same mix as I am? In more technical terms, what is the mixed strategy Nash equilibrium of archetype selection?
The answer to this question has two practical implications:
- First, it provides an optimal mix of archetypes, so you could aim to replicate this mix by choosing different decks randomly according to the suggested probability distribution prior to each game. This is indeed possible, but a) people don't usually randomize like this in reality, and b) not everyone is equally skilled at playing all of the top archetypes (or they don't have enough dust to create them all).
- Second, we can compare the optimal distribution to the actual distribution played in ladder matches. This will show us which archetypes are currently being over-played and which are under-played, relative to their theoretically optimal percentage of times used. That is, if the equilibrium probability with which you should play archetype X is 10% but it's actually being used 25% of the time, that's a good reason to decrease your use of the deck, since you might soon be facing decks that do particularly well against it. Conversely, if archetype Y is actually played only 5% of the time but theoretically it should be played 30% of the time, then, if possible, you might want to switch to using this archetype, since it should do especially well against those currently in use.
With these implications in mind, let's first take a look at the current meta and percentage use of the top archetypes. Then we'll figure out the equilibrium to the archetype selection game, and finally compare this equilibrium to the actual use to see which archetypes are being over- and under-played.
(As an extra-special treat, I'll make you a deal. I did most of my analysis using R, so for those who know the language and are interested, I can send you the code I used for the calculations in this article. And if you're so inclined, help me improve the code; I especially need to figure out the optimization calculation described in the technical appendix.)
Top Deck Archetypes
Let's start with the recent high-level meta – to be precise, 12 days of standard ladder games played between April 20 and May 1, 2020, by players of Diamond and Legendary ranks, in both the US and EU. Even with these limits the data set is of an impressive size: over 4.8 million matches in all.
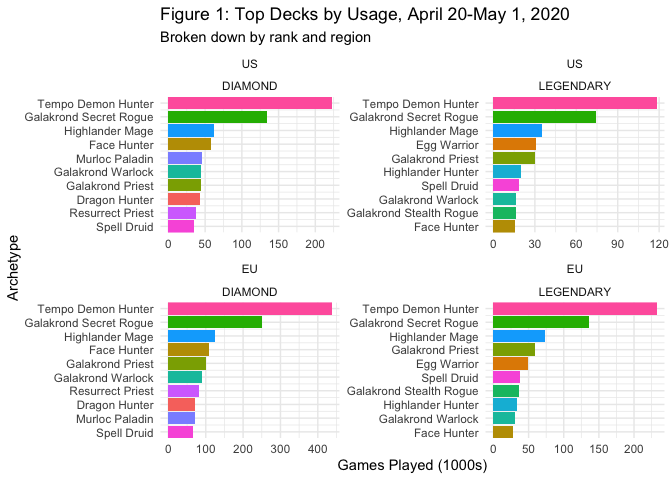
As a first look at the data, Figure 1 shows the most-used decks in each region and rank level.2 There is a good degree of overlap among the graphs; for instance, the top three decks were the same in all groups. And the most-used deck by a good margin is Tempo Demon Hunter, which is not surprising since it uses the new hero added in the latest expansion, still very strong even post-nerf. But after that some interesting divergences appear, such as the fact that Face Hunter is far more popular in Diamond than in Legendary matches, and vice-versa for Spell Druid. Together, these archetypes account for about 70% of all decks played in standard ladder matches during the given time period.
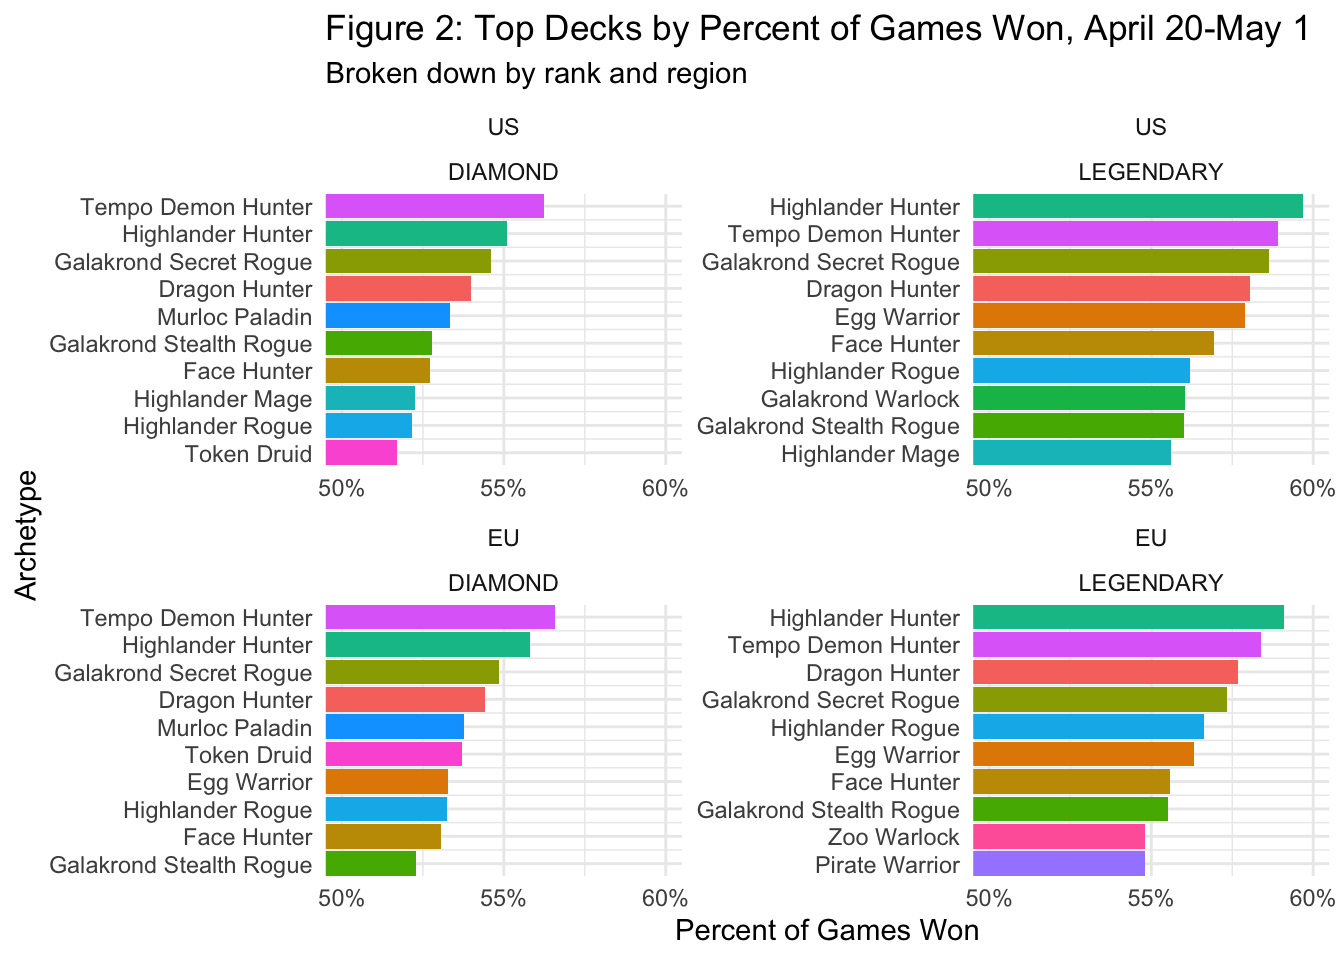
We can also visualize the top archetypes by percentage of games won rather than usage (see Figure 2 below). Interestingly, Tempo Demon Hunter has the highest winning percentages at the Diamond level but not among Legendary matches, where Highlander Hunter edges it out. And while Murloc Paladin is the fifth highest in both Diamond lists, it does not appear at all in the Legendary lists.
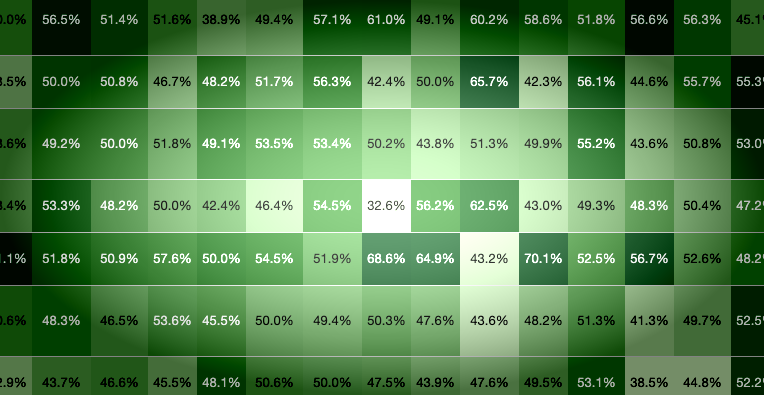
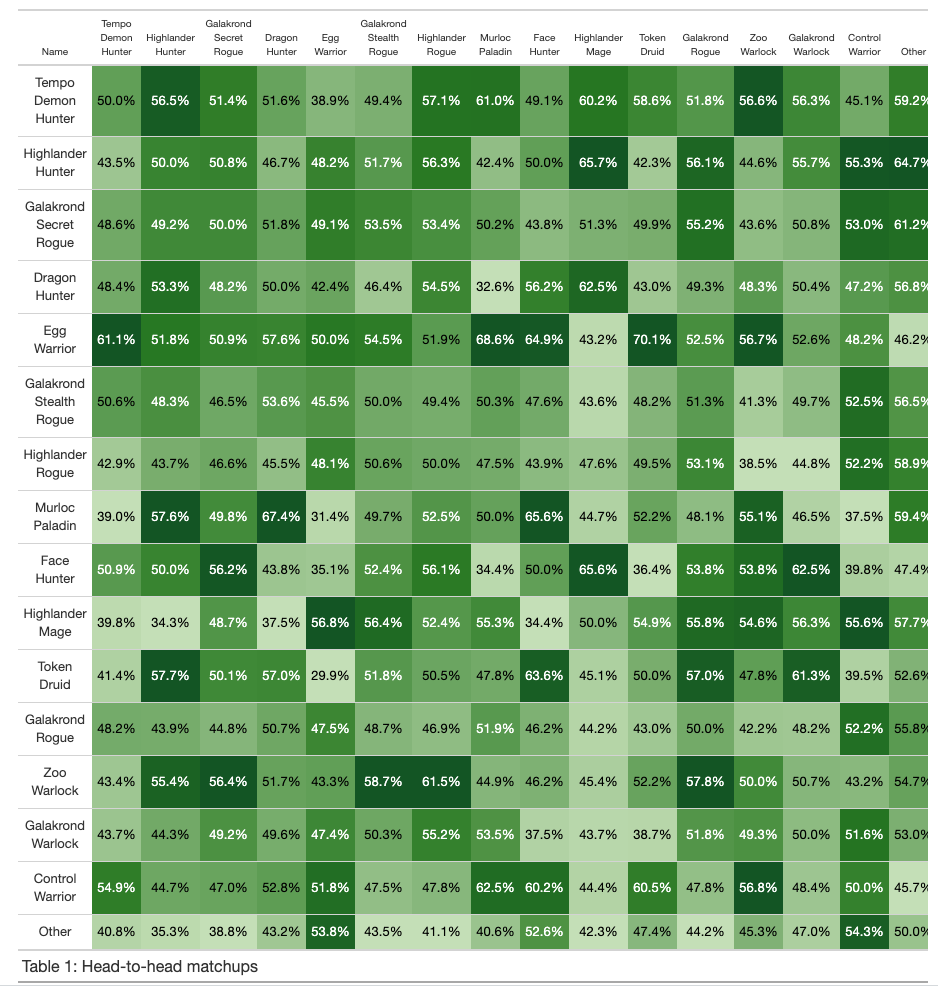
Both Figures 1 and 2 can give us an overall impression of each archetype's popularity and strength, but practically speaking, archetype performance usually depends on which archetype it is paired against. Thus, we need to disaggregate these numbers into a crosstable showing the results of all head-to-head matchups among the archetypes in our list. These appear in Table 1 below for the top 15 archetypes according to overall win rates.3 I've also added an “Other” column to the table to show how each deck performs against the remaining ~30% of all decks that did not fall into the top-15 archetypes list.4
The darker the shade of green in a table cell, the higher was the winning percentage of the row deck vs. the column deck. The table reveals some interesting patterns; for instance, despite its overall strength, Tempo Demon Hunter wins less than 40% of its games against Egg Warrior. Murloc Paladin does very well against certain decks and abysmally against others, while Galakrond Rogue performs more or less the same against all opponents.
We can even detect cycles in the results. For instance, Face Hunter beats Galakrond Secret Rogue, which beats Dragon Hunter, which in turns beats Face Hunter.5 And so on. In sum, we have a lot of complex and interesting data on the relative strengths and weaknesses of of various archetypes. How can game theory help us translate these statistics into usable strategic recommendations?
Game Theory Background
To understand what type of solution game theory can give us, let's digress for a moment to a game everyone knows: rock, paper and scissors (RPS). Here, too, there is no one best strategy: each option beats one of the other choices and loses to the other, as shown by the game table in Figure 3 below, where each player scores +1 for a win, -1 for a loss and 0 for a draw:
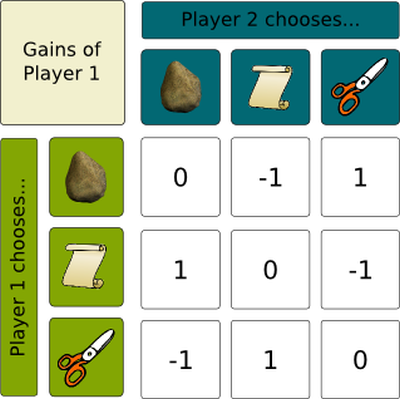
As any experienced RPS player knows, sticking with any one strategy for a long time is suicidal; if you always played paper for instance, your opponent could play scissors and win every time. So it's clear players have to mix things up a bit. But not just any randomization will do. If, say, your opponent played rock 1/2 the time and paper 1/2 the time, then you could counter by playing paper all the time. This would tie when your opponent plays paper and win when they play rock, so in the long run you'll come out far ahead.
How should players randomize so as to even things out? The answer, of course, is to play each option 1/3 of the time.6 Facing such a strategy, it does you no good to play any one option all the time; in fact, no matter what you do, you'll win on average 1/3 of the time, lose 1/3 of the time, and tie 1/3 of the time. So you might as well randomize 1/3 | 1/3 | 1/3 too. This is what we call the mixed strategy equilibrium to RPS, where the “mixing” indicates that in equilibrium, the contestants play more than one strategy with positive probability.7
Application to Hearthstone
To transfer the basic concepts of game theory to Hearthstone, in place of the simple 3x3 table of results in RPS, we will analyze the 15x15 matrix of outcomes from Table 1 above. We can then compare the recommended probabilities of the mixed strategy Nash equilibrium to the actual distribution of decks played from Figure 1. It's clear that the equilibrium calculations here will be much more complicated than for Rock-Paper-Scissors, since there are many more types of players and the table of win percentages doesn't display the simple symmetry of RPS. But the basic logic remains the same: you should play different strategies to maximize your chances of winning, knowing that other players are also choosing their decks strategically.
Results from the mixed strategy equilibrium are shown below in Figure 4. For each archetype the figure shows its percent of actual matches observed (the red dot), compared to its ideal usage rate provided by the mixed strategy equilibrium (the blue dot).8 Archetypes are deemed overused when Actual usage is greater than Nash usage (indicated by a left-pointing arrow) and underused when Actual usage is greater than Nash usage (indicated with a right-pointing arrow.
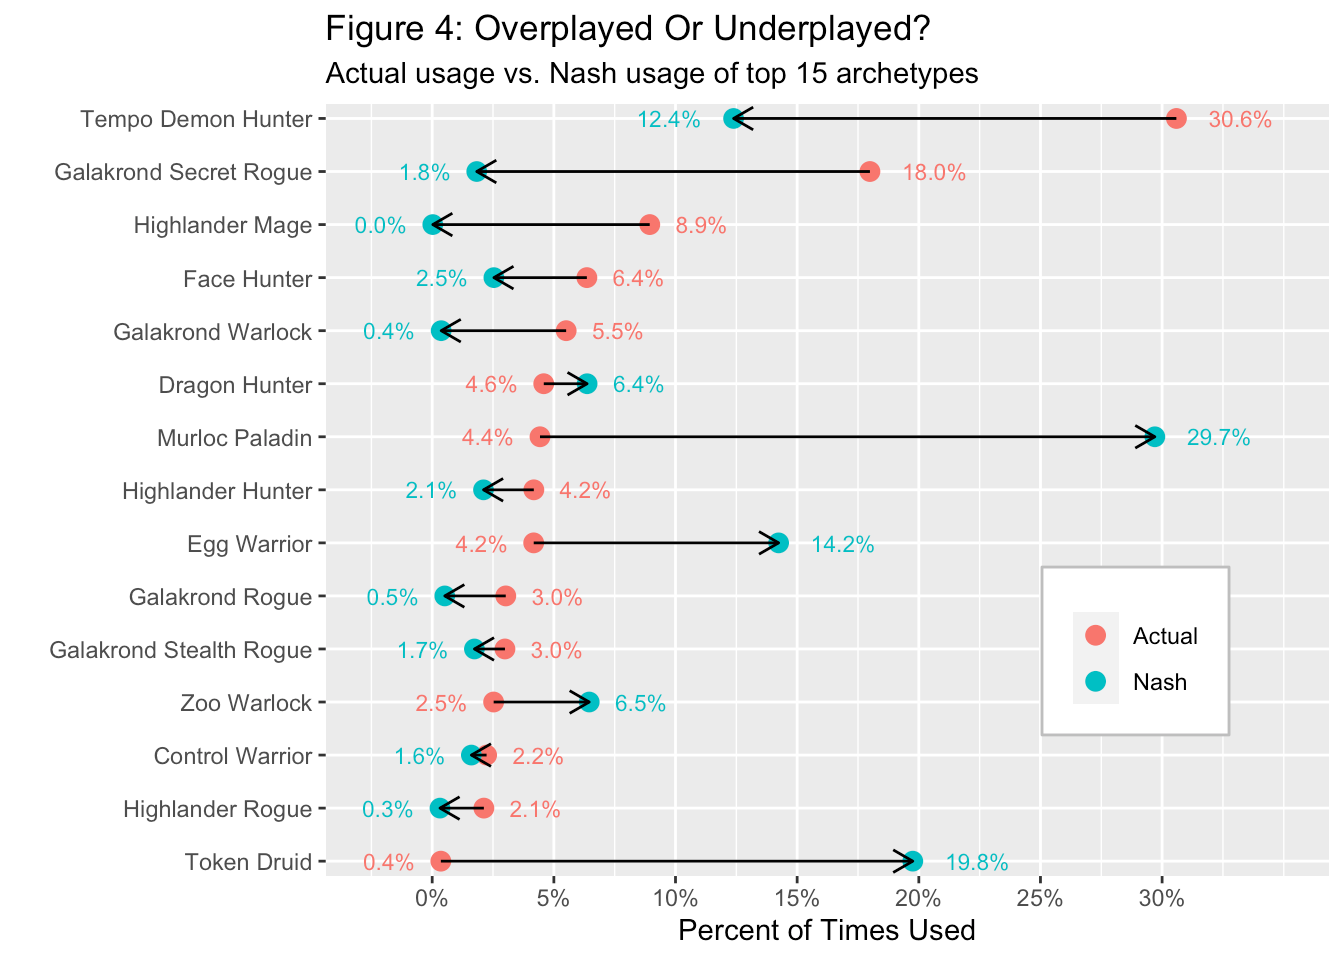
As you can see, results from the mixed strategy equilibrium offer some clear winners and losers. Three archetypes – Murloc Paladin, Egg Warrior and Token Druid – stand out as being the most underplayed. On the other hand, the most popular archetypes – Tempo Demon Hunter, Galakrond Secret Rogue, and Highlander Mage – are significantly overplayed; in fact, in equlibrium Highlander Mage is hardly used at all.
How should we understand these results? There's no single rule of thumb that explains the equilibrium, so readers are free to figure out their own opinions. I would note, first of all, that the differences in winning rates among the top decks are not great, so strategic matchup factors become all the more important. And Murloc Paladin's high level of recommendation might come from that fact that it has the highest winning percentage against the Other decks, while doing quite well against some of the other popular decks, such as Highlander Hunter and Zoo Warlock.
So what does this mean for our fellow Hearthstone players? The most straightforward conclusion is you should play over-used archetypes less and under-used archetypes more. However, we must be cautious when interpreting these results; remember, these are average results over all players (i.e., regardless of rank or skill with a particular deck). Thus if you are particularly good at playing a given deck, and less sure of yourself with others, you might want to stay where you are (and let other players do the changing). Of course, most good players are able to switch smoothly among different decks and strategies (aggro, mid-level, control, etc.), so these considerations might not represent such a high barrier for them.
In addition, the Nash equilibrium usage rates are certain to change significantly over time, probably day-to-day, so it pays to stay up to date on the suggestions, especially as the new meta begins to play itself out.
Conclusion
This article applied game-theoretic reasoning to the choice of Hearthstone decks, providing insight into which decks/archetypes are under/overplayed. The results can give players an additional tool for deciding which decks to use in their ladder matches.
Note that the same reasoning would apply to tournament situations, where each side has a limited number of decks available. The methodology would be the same: look at the head-to-head matchups and then calculate the optimal mix of decks to play in any given round.
Happy hunting!
David has an advanced degree in economics, with specializations in game theory and online card games.
Footnotes
- To be precise, a deck is a particular choice of 30 cards to play. A deck archetype is defined by a core set of cards, which different players fill out in different ways to create their decks, but all use essentially the same strategy. So Resurrect Priest is an archetype, for example, and that's what we'll be talking about in this essay. But I'll use the terms interchangeably in certain places to introduce a bit of variety into the prose.
- The different x-axis scales indicate that there were roughly twice the number of diamond vs. legendary matches, and roughly twice as many matches in the EU as opposed to the US.
- For clarity of exposition, from here on out we will treat the data set as a single set of results, rather than breaking them down by rank and region. It would be interesting to see how the final results differ from place to place and rank to rank; perhaps in the next article we can explore these topics further.
- Full disclosure: when I first ran the analysis I didn't include the Other data in the calculations, and Egg Warrior was given as the deck that should be played most often. Some digging revealed that this was due to the fact that while Egg Warrior performs very well against the other top-15 decks, it performs second-to-worst against all others, winning under 50% of its games.
- Of course, this type of cycling is actually one of the foundations of the game: the usual statement is “Aggro beats Midrange, Midrange beats Control, and Control beats Aggro.”
- In RPS the equilibrium is obvious: a symmetric solution to a symmetric problem. In general, though, given a table of results (called a payoff matrix), there is a mathematical procedure to calculate the mixed strategy Nash equilibrium.
- A technical note: this discussion depicts mixed strategies arising from players' randomly choosing one deck or another. It's hard to imagine players literally generating random numbers to decide which strategy to use. Alternatively, though, we can think of a large population of players who play some combination of strategies such that, whatever their individual strategies might be, on any given turn 1/3 will play rock, 1/3 will play paper and 1/3 will play scissors overall. In this situation as well there is no advantage to playing any particular strategy over another, so the Nash Equilibrium might characterize the strategies of a population of players as a whole, even if no one player exactly hews to it.
- In order to get an apples-to-apples comparison with the Nash equilibrium predictions, the Actual usage rates here were rescaled to give the percentage of times each deck was played relative to the other top 15 decks. Also, the “Other” category is not shown here, as in equilibrium these decks should be played just 0.05% of the time.